Welcome back to Article 4 in a series dedicated to increasing awareness of factors that can affect metabolomic (and other omic) data quality. Following the previous article about how the choice of adherent cell detachment method can affect metabolomic and other omic data, today I’ll continue the 42 Factors Series with a discussion of matrix effects. We’re not talking about simulated reality and the ability to dodge bullets (sorry, I couldn’t resist referencing one of my favorite movies); the matrix effects I’m talking about can decrease assay sensitivity and lead to inaccurate results and conclusions with all types of omic data.
I’ll approach the discussion with a focus on mass spectrometry (MS), but please understand that virtually all measurement technologies and assays exhibit matrix effects.
Let’s dive in with an introduction to matrix effects by focusing on three questions: what are matrix effects, how much of a problem are they, and how can we minimize their impact on data quality?

For starters, when one wishes to measure the absolute level of any analyte (be it DNA, RNA, protein, or metabolite), it’s necessary to generate a standard curve—a plot of instrument response as a function of analyte concentration. Let’s assume we’re talking about an analyte for which a reference standard is commercially available, such as glutamine. We’d first create a stock solution of glutamine at a known concentration in, say, water (in which glutamine exhibits high solubility), then we’d create a series of glutamine dilutions in an MS-friendly solvent, and finally we’d measure the instrument response at each of the chosen glutamine concentrations. The resulting standard curve might look like the following:

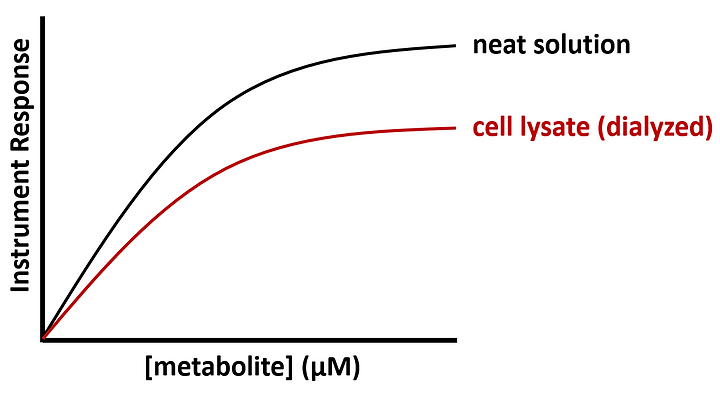
But since our goal is to measure glutamine levels in a biological matrix, a neat standard curve (i.e., solvent-only matrix) usually won’t help us; we really need a standard curve in the biological matrix of interest. Let’s start with the simple case of cancer cell lines. A common problem in metabolomics is that the target analyte that we’re trying to measure is usually present in the biological matrix of interest (a cell line in this case), and those background levels of the target analyte present a challenge. To generate an accurate standard curve in a cell lysate matrix, for example, we would need to dialyze the cell lysate to create a matrix devoid of the target analyte. After going through that tedious process and spiking in known concentrations of glutamine, we might see the following result:

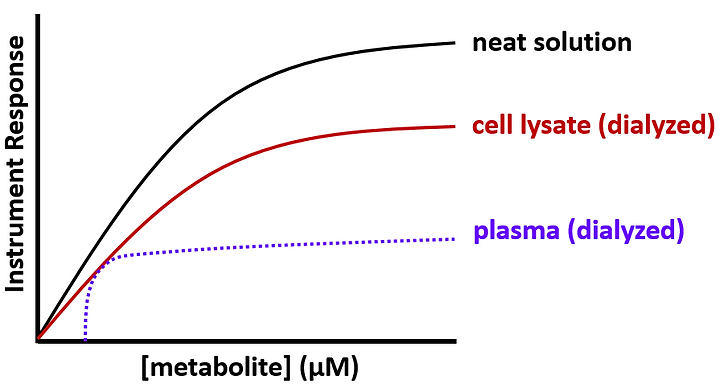
Why don’t the two curves overlap? Answer: interferences that are not present in the neat solution are present in the cell lysate, resulting in suppression of the target analyte signal (i.e., instrument response). The difference between the curves is referred to as a matrix effect; “matrix effect” is synonymous with “interference.” A quantitative parameter, matrix factor, essentially represents the distance between the neat solution curve and the biological matrix curve; a larger matrix factor indicates a larger matrix effect. Consider an even dirtier biological matrix such as plasma:

The observed suppression (matrix effect) is even more pronounced in plasma. This is relatively common; matrix effects tend to be larger (worse) in more complex matrices. That is why whole blood and tissue lysates are generally considered to be the most challenging matrices to work with.
A caveat. Although matrix factor generally increases in proportion to the complexity of the matrix, simple biological matrices (e.g., urine) can exhibit larger matrix factors than their complex counterparts (e.g., whole blood). For example, in liquid chromatography-mass spectrometry (LC-MS), if a phospholipid co-elutes with the analyte of interest, the analyte of interest usually exhibits a much weaker instrument response (suppression) because the phospholipid interferes by competing for charge during the ionization process in the MS. If the offending phospholipid is present in urine but not whole blood, urine would be the more challenging matrix to deal with. Hence, it’s worth bearing in mind that whole blood is not always more challenging to work with than other matrices (but it’s often the case).
Another potentially major issue caused by matrix effects is truncation of the linear dynamic range, as illustrated in the plasma curve above. To circumvent that issue and ensure that accurate comparisons are made between samples, one effective strategy is to analyze multiple dilutions of each sample. Doing so will increase the likelihood of quantitation in the linear range of the assay. Measurements that are outside of the linear range of quantitation can yield inaccurate results and conclusions.
Three additional strategies for mitigating matrix effects (focused primarily on MS) include: i) modify the chromatographic system to resolve target analytes from interferences; ii) conduct a sample cleanup procedure capable of eliminating interferences; and/or iii) add a chemically-matched stable isotope-labeled internal standard to the sample. In MS, the most common chromatographic systems are liquid chromatography (LC), gas chromatography (GC), and ion chromatography (IC). If the interference is identified to be a phospholipid (which you can discover by monitoring common phospholipid-specific transitions on a triple quadrupole MS), changing the chromatographic conditions can often resolve the interfering phospholipid from the target analyte. Alternatively, one could conduct phospholipid depletion (e.g., using a Waters Ostro Phospholipid depletion plate). In some instances, those two strategies have the ability to eliminate matrix effects entirely. After the interference is resolved from the target analyte or depleted from the sample, key quantitative parameters (including accuracy, precision, and sensitivity) will generally increase significantly.
A third strategy is to add a chemically-matched stable isotope-labeled internal standard (see this excellent review article for more details). Briefly, if the target analyte is glutamine, we could spike in a known concentration (e.g., 10 µM) 13C5-glutamine to the sample and to all standards used to build the standard curve. Quantitation is then conducted using the measured ratio of 12C5-glutamine/13C5-glutamine. Since 13C5-glutamine and 12C5-glutamine will generally be exposed to the same matrix effects, the ratio is corrected for matrix effects. However, there are a few caveats to keep in mind when using stable isotope-labeled internal standards for correction of matrix effects: a) this strategy fails to correct for matrix effects if the analyte and internal standard exhibit variable degrees of ion enhancement or suppression (i.e., the analyte and standard are affected differently); and b) this strategy fails if the analyte and internal standard exhibit variable extraction recoveries. The former situation is a high risk if using deuterium (2H)-labeled internal standards, which can shift in retention time from the target analyte, and the second situation tends to be a problem when the chosen concentration of the internal standard is very different (e.g., 100-fold) than the concentration of the target analyte.
“But I don’t do mass spectrometry” you say, “so why should I care about any of this?” I’ll conclude with a final example. In cancer research and the life science sector in general, one of the most common measurements is the Western Blot, and…drumroll…yes, matrix effects impact Western Blots. Specifically, before conducting a Western blot, a researcher will typically measure the total protein level in each of the samples to be analyzed. A common mistake is forgetting to match the matrix of the sample lysing buffer when generating the protein standard curve. For example, a target protein may have been extracted from samples using a buffer lacking SDS vs. a buffer containing SDS, or perhaps the goal is to compare levels of a target protein in brain tissue vs. liver tissue. In those instances, matrix effects can lead to inaccurate measurement of total protein concentration, resulting in inaccurate loading and, consequently, inaccurate conclusions.

Before closing out this introduction to matrix effects, it’s important to note that matrix effects don’t always result in suppression of the target signal; sometimes the target signal is enhanced in the presence of a particular interference, causing the instrument response to be greater than observed in neat solution. Enhancement is not common, but it does occur and is detrimental to measurement accuracy.
If you’re an experimentalist who measures anything (DNA, RNA, protein, small molecules, etc.) please be mindful of matrix effects—they’re everywhere. Another tip: before purchasing new equipment, it can be helpful to conduct a test of matrix effects. Surprisingly, some instruments may be highly sensitive to a particular type of interference, whereas a competing technology may be resilient to the effect.
Take-home messages: 1) identify the presence and magnitude of matrix effects by comparing standard curves in neat solution vs. biological matrix; 2) mitigate matrix effects by chromatographically resolving the target analytes from the interference(s); 3) mitigate matrix effects by conducting a sample cleanup procedure capable of eliminating the interference; 4) mitigate matrix effects by using a stable isotope-labeled internal standard; 5) increase the probability of quantitation in the linear range of an assay by analyzing multiple dilutions of each sample; and 6) before purchasing new equipment, consider assessing matrix effects associated with key assays.
Thanks to present and former members of my team, especially Thomas Horvath for advancing my understanding of matrix effects, and to readers like you for your helpful comments, questions, and stimulating discussions!
Do you have any experience with matrix effects? Have you seen instances of matrix enhancement? Do you have any pressing metabolomics questions? Leave a comment.

0 comments